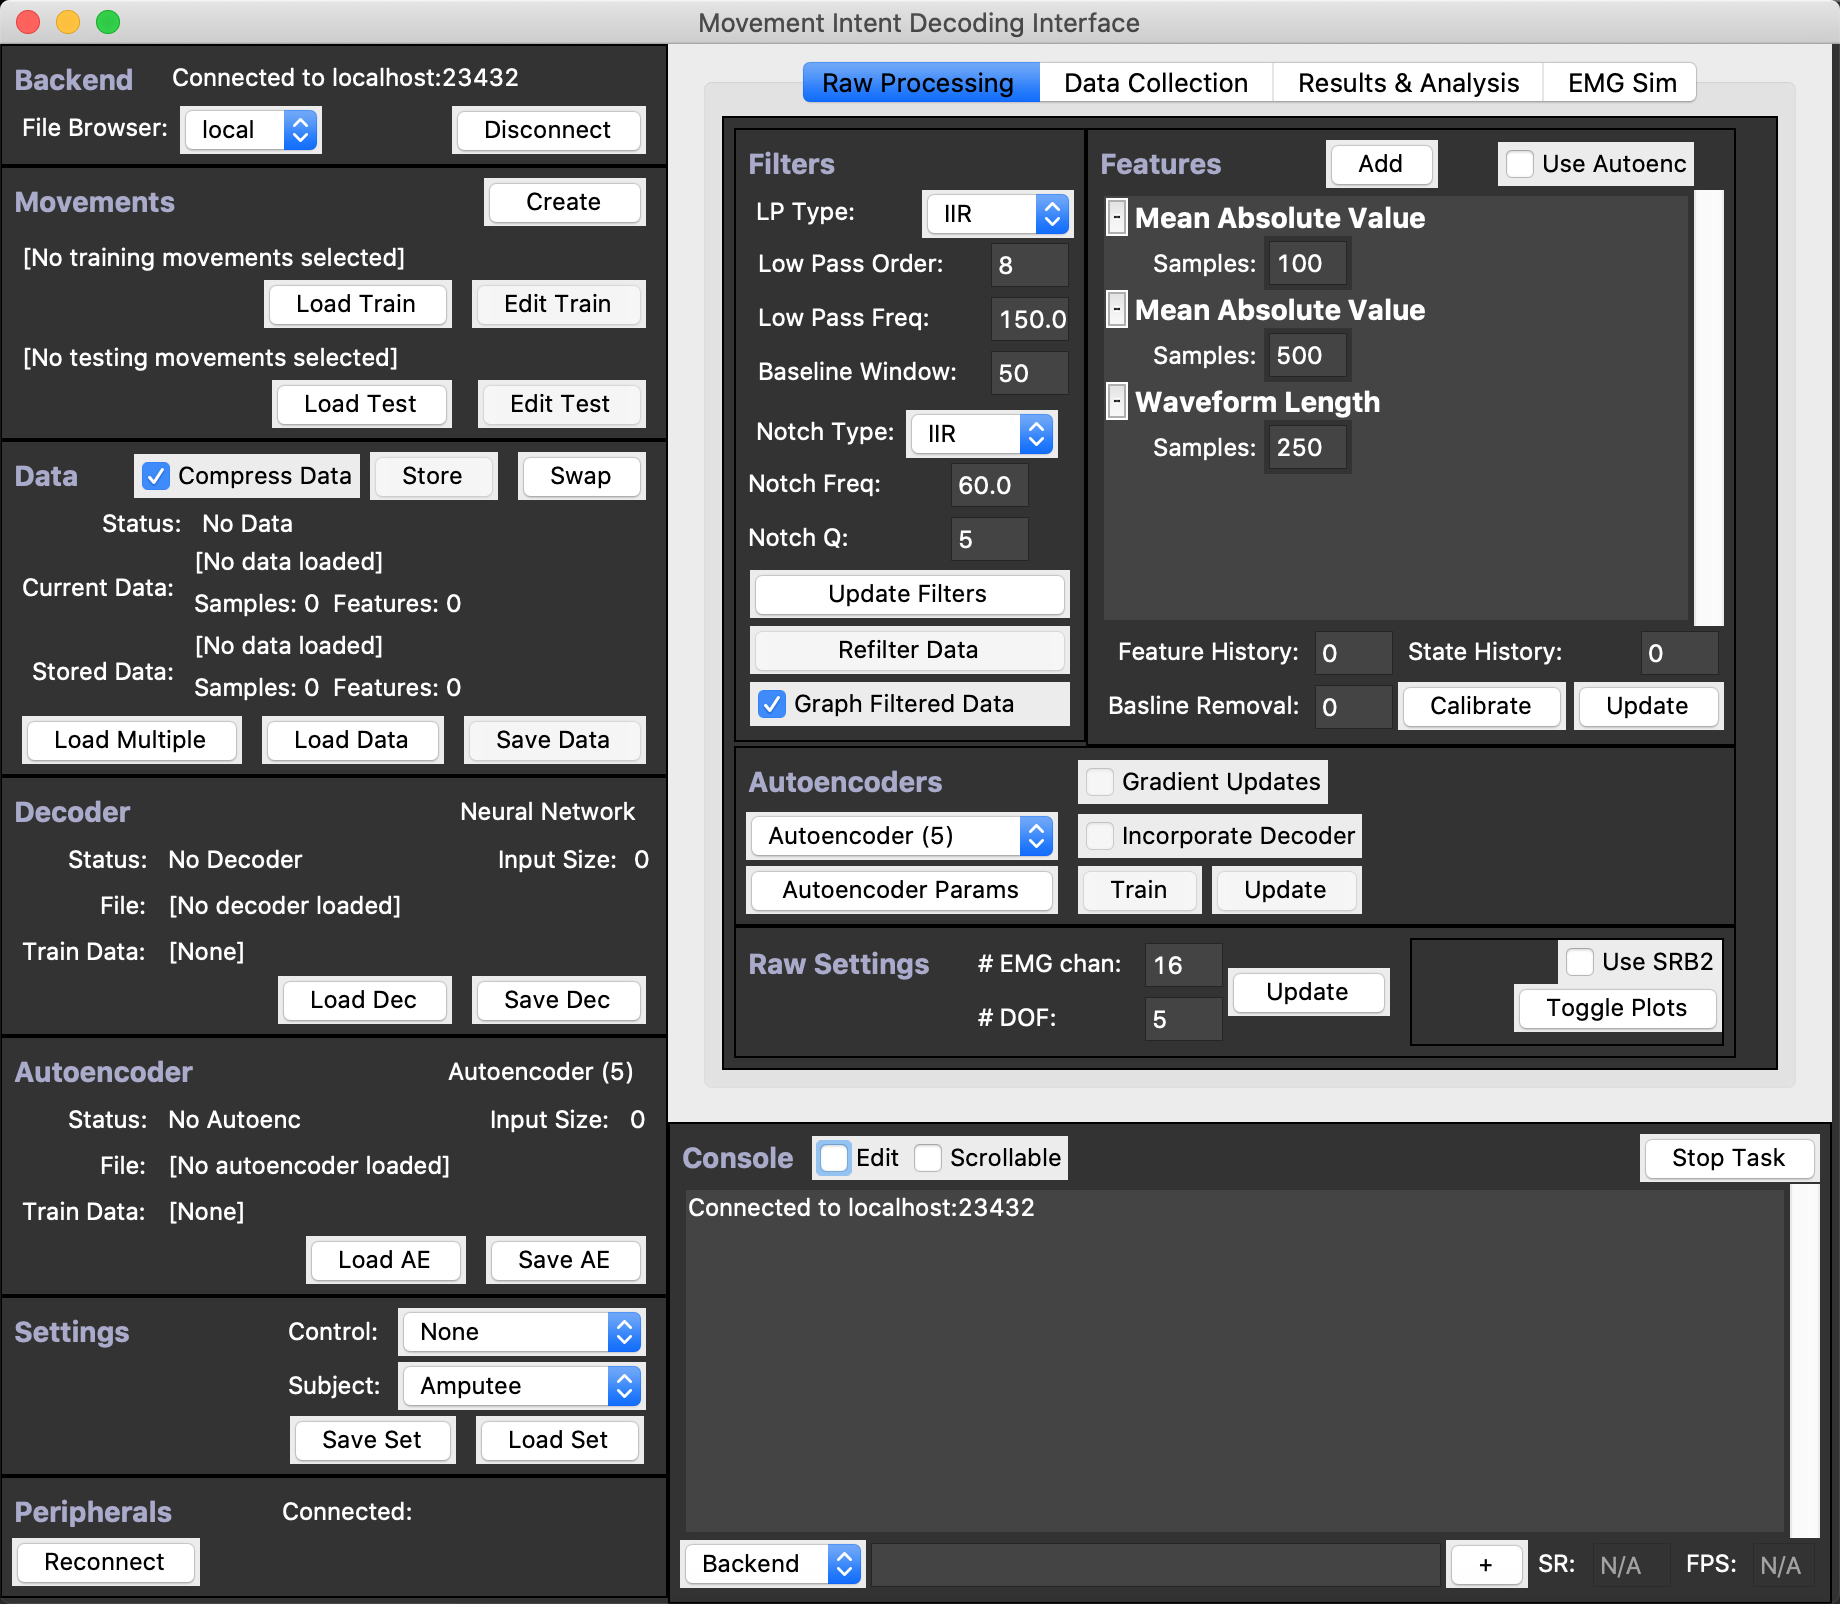
Overview
This is the GUI as it looks upon startup. There’s a lot going on, so we’ll start with a high level overview.
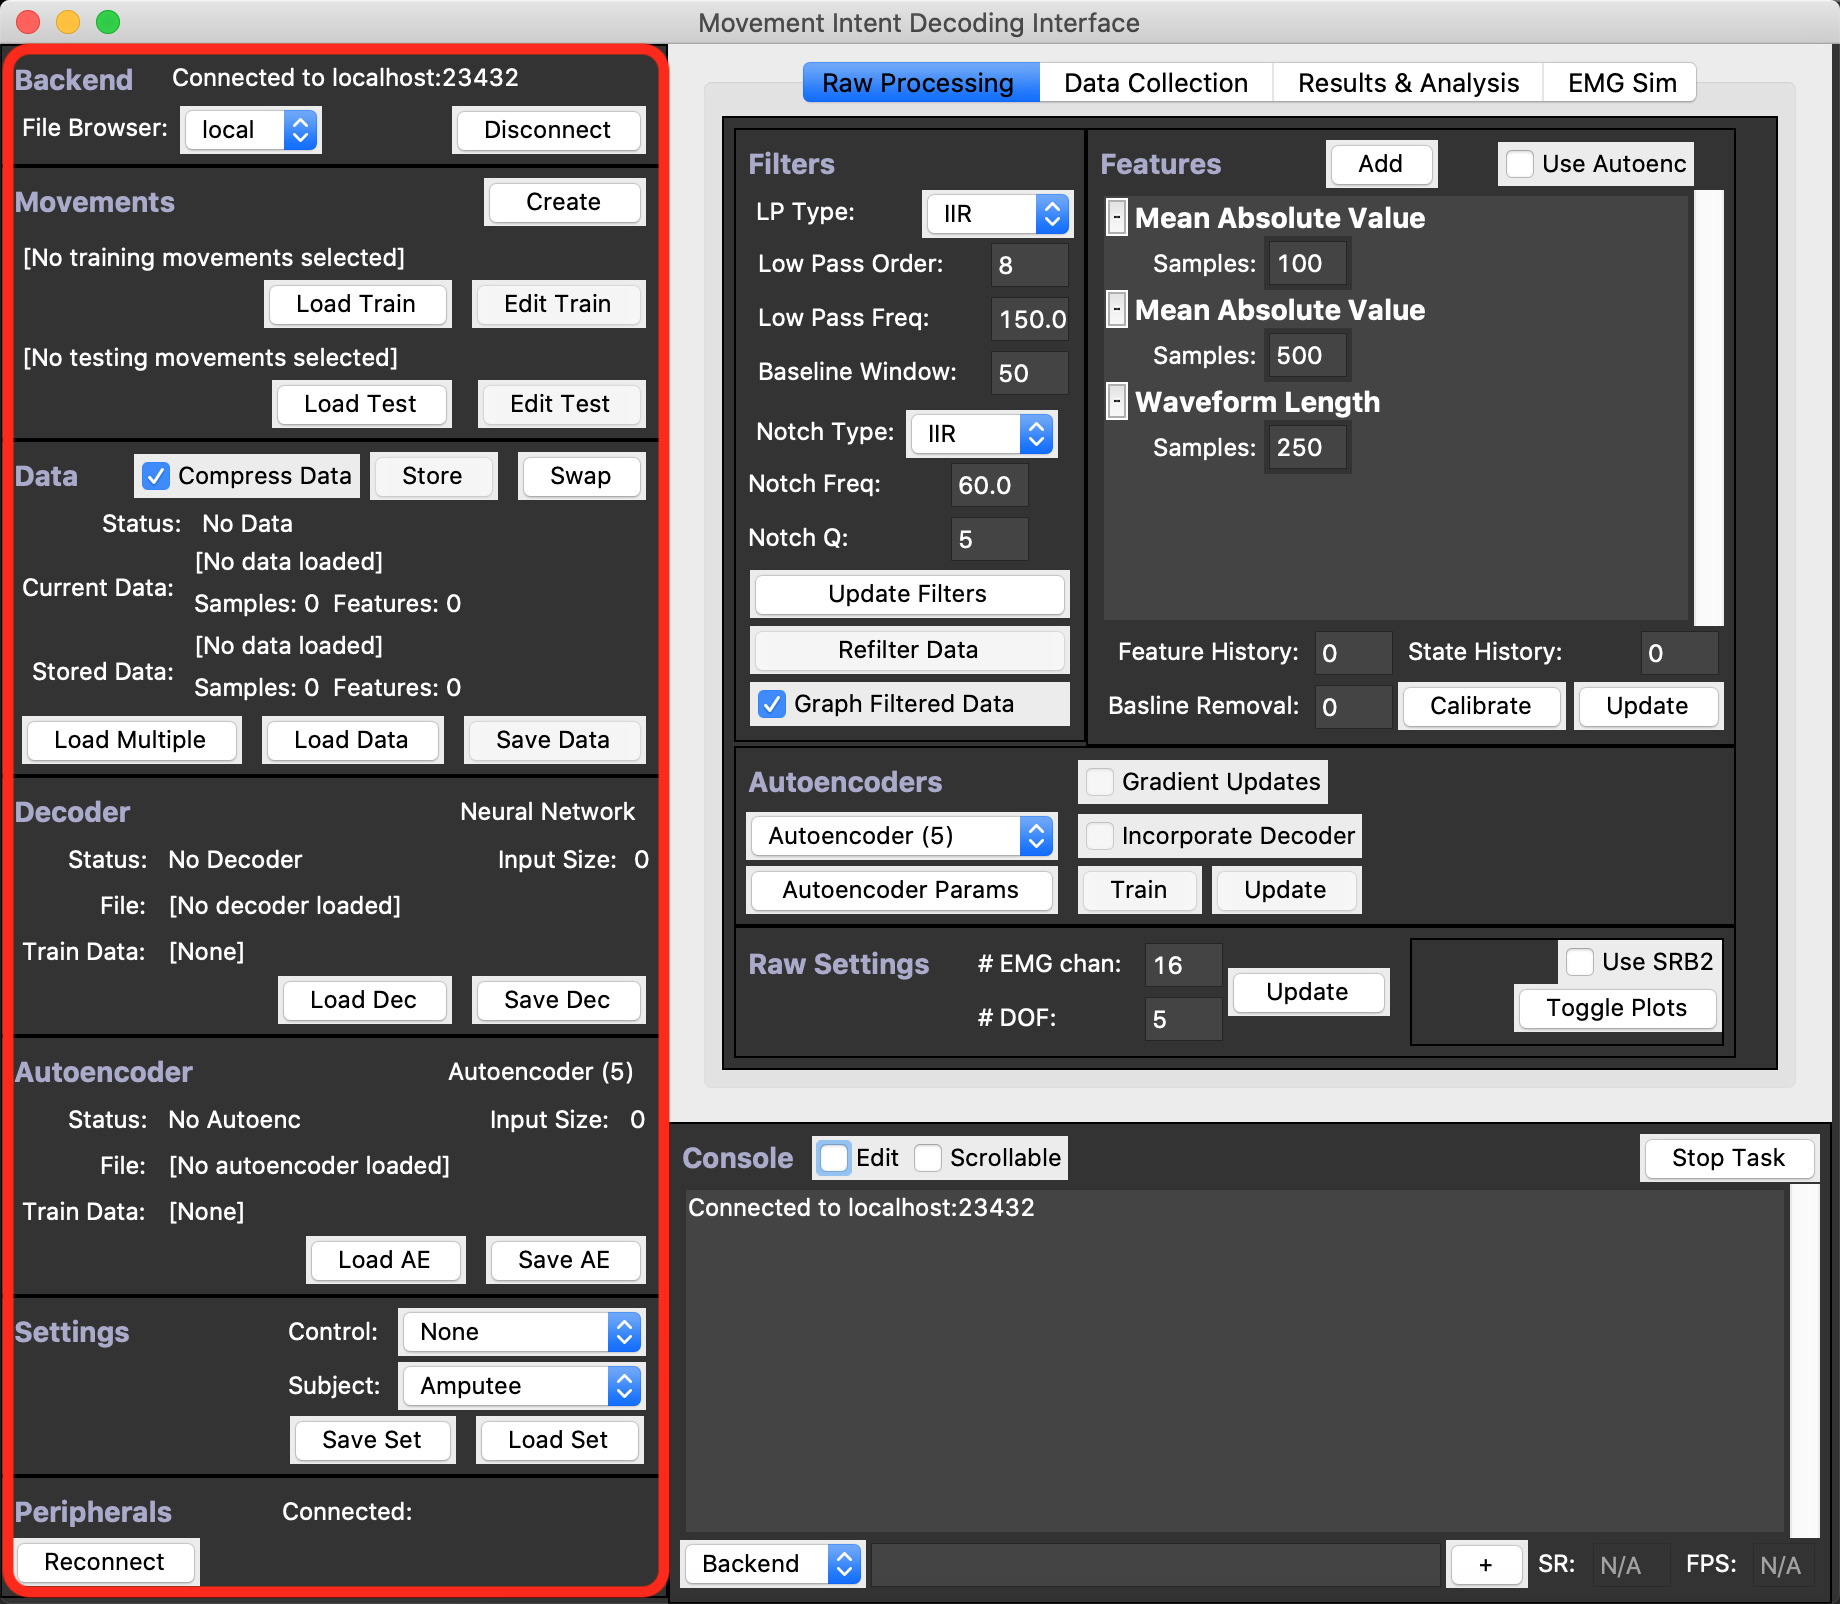
The Status Side Bar
The left sidebar, outlined in red below, holds the status of most objects as well as the functionality needed to Load/Save/Disconnect/Connect said objects. See the Status Sidebar page for more details.
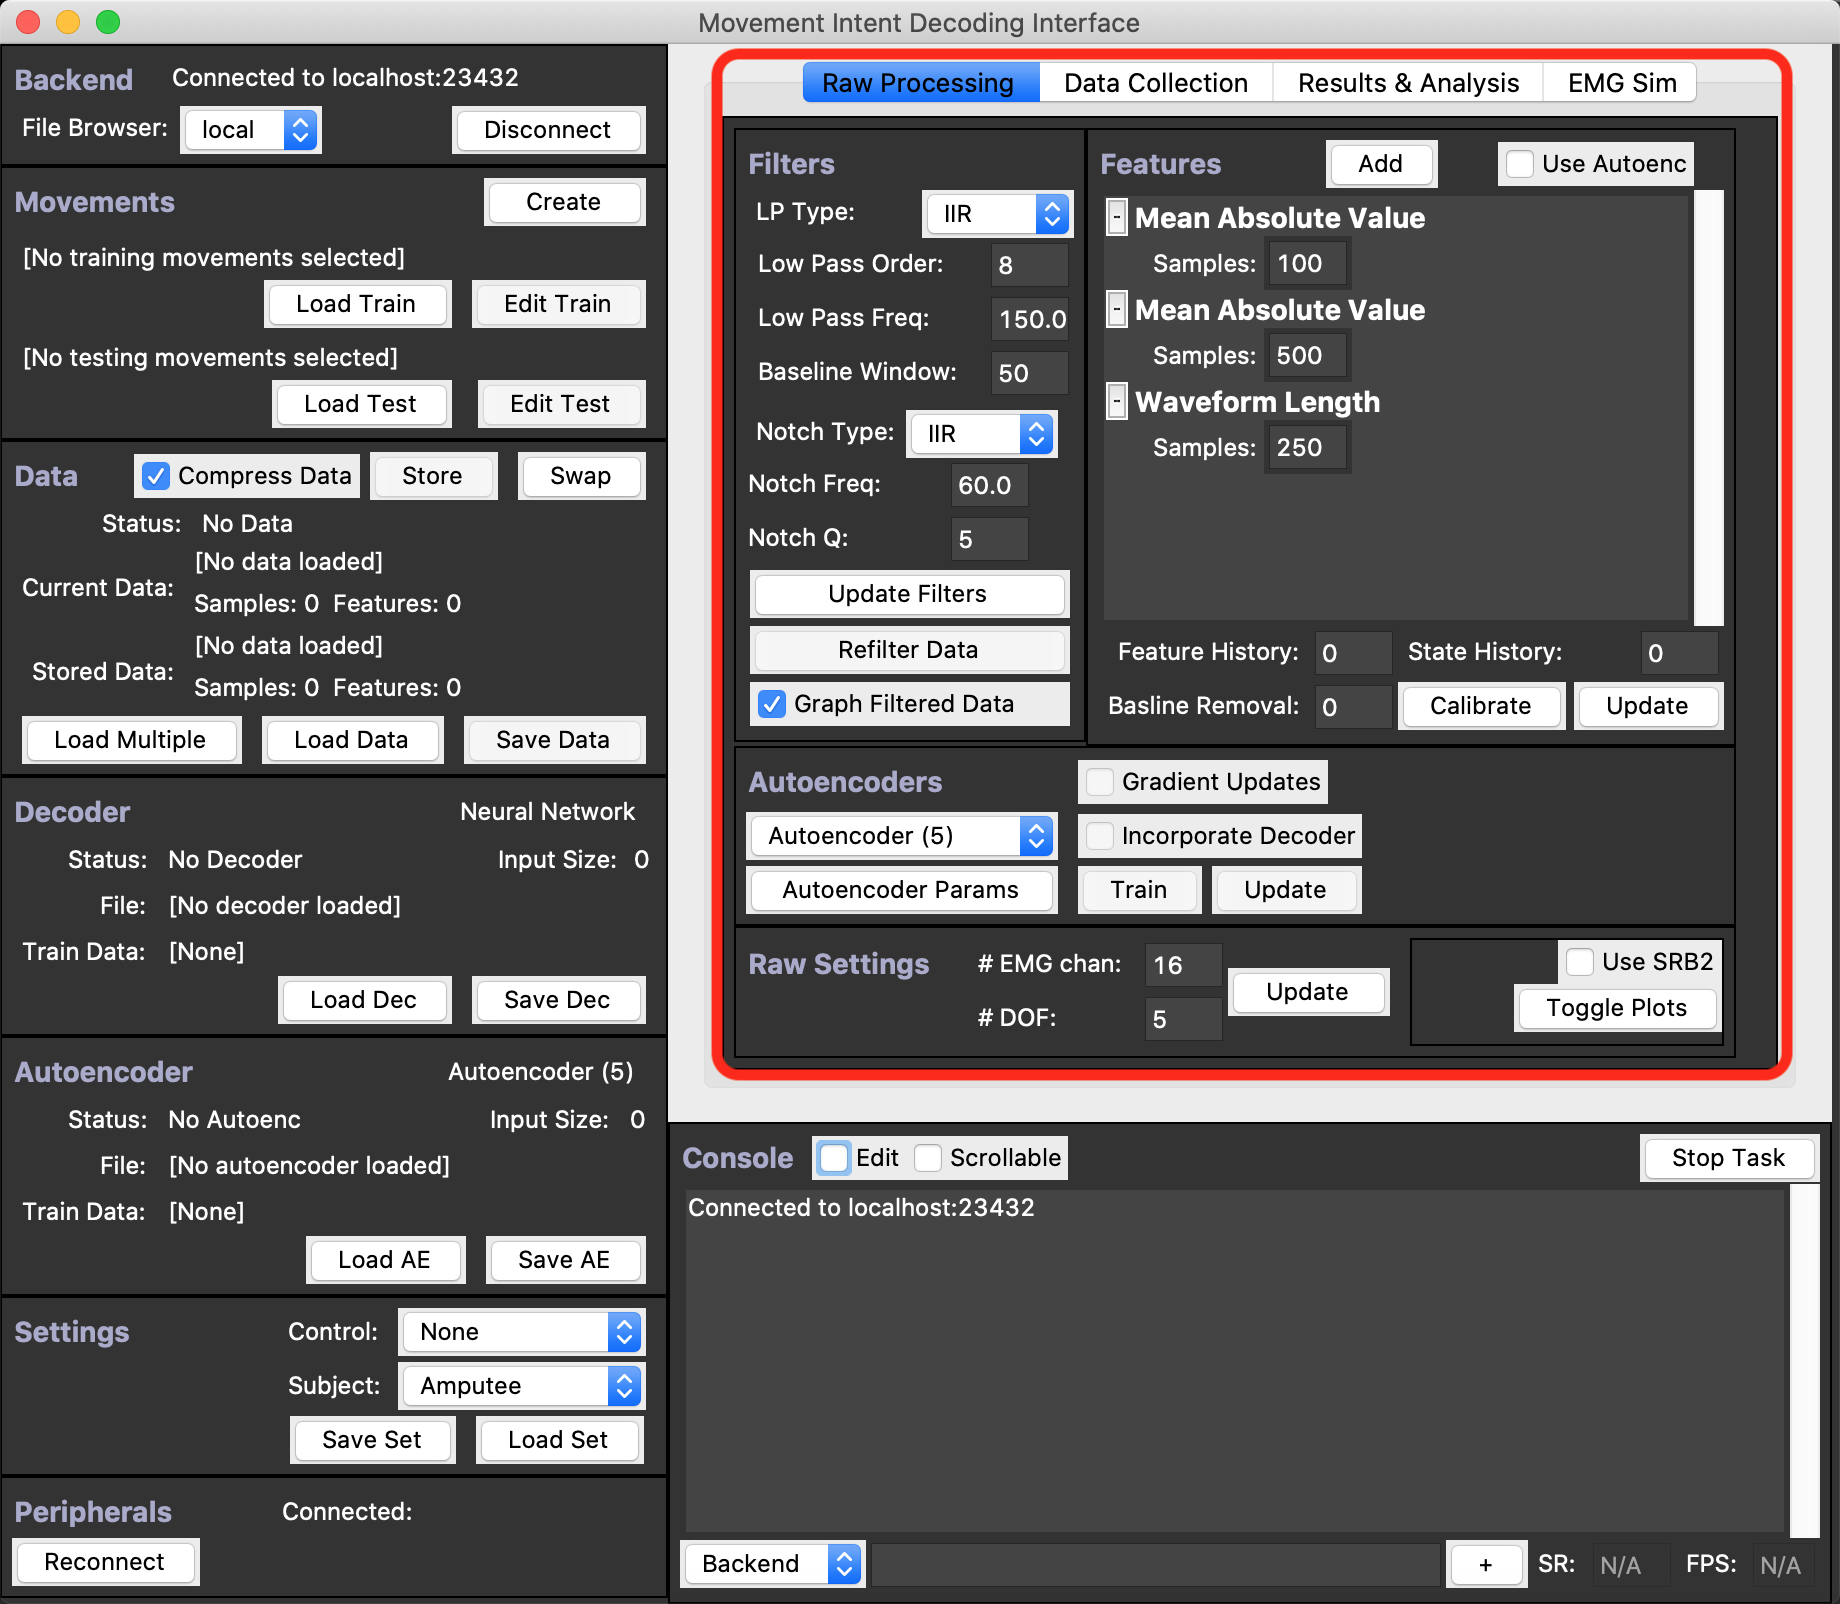
The Tabbed Content Window
The center of the GUI, outlined in red below, is a small tabbed window containing the major functionality of the application.
As you can see, there are 4 Tabs: Raw Processing, Data Collection, Results & Analysis, and EMG Sim.
Switch between these tabs to access their functionality.
To see more details about each of these content tabs, see the following wiki pages dedicated to them:
[[Raw Processing]], [[Data Collection]], [[Results & Analysis]], and [[EMG Sim]]
…
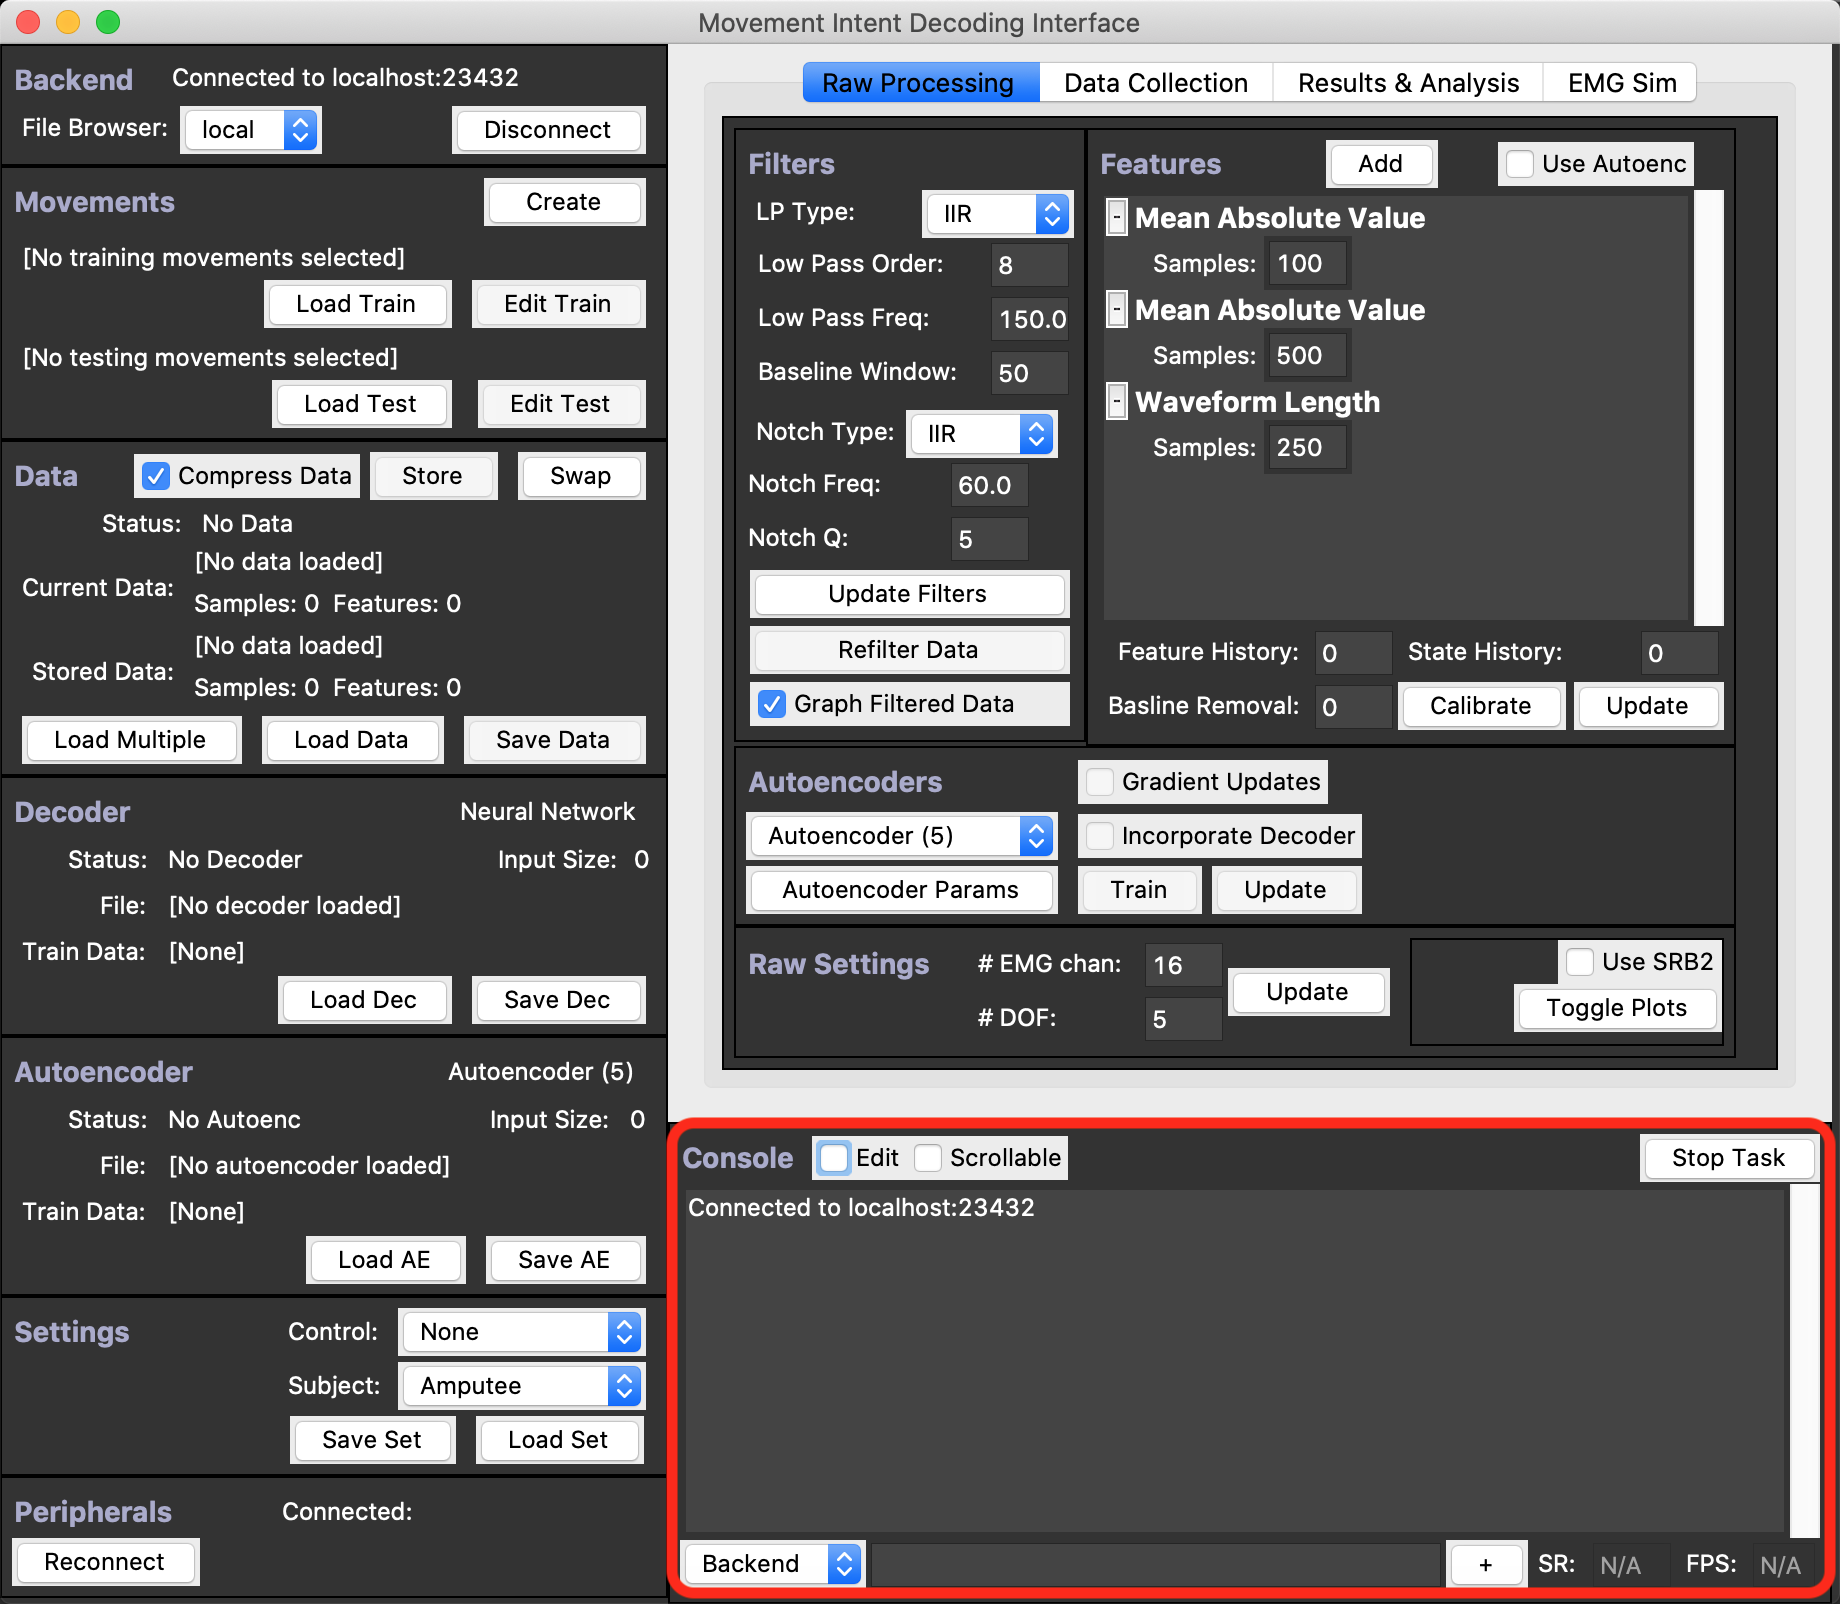
The Console
The Console Frame, outlined in red below, contains the output console in which a variety of messages and errors are printed, as well as some other helpful debugging tools, and the current sample rate (SR) if an EMG Peripheral is connected and the decoding rate FPS of the main output loop used for prosthetic control. This Frame also contains a handy debug box which can be used to run Python in either the Backend or GUI’s scope.
More Details on the Console can be found in [[The Console]], and some useful commands for the debug box are described in [[The Debug Box]].
The Top Menu
Last but not least, don’t forget about the Top Menu, the Mac version of which is shown below. This contains all Saving and Loading Functionality, the ability to run Python scripts in the Backend, and also the ability to Record and Save actions you make in the GUI. More details can be found in [[The Top Menu]].
